
A notebook that should use a module#
import numpy as np
import matplotlib.pyplot as plt
import nibabel as nib
A copy/paste of the code from on_modules:
def vol_means(image_fname):
    img = nib.load(image_fname)
    data = img.get_fdata()
    means = []
    for i in range(data.shape[-1]):
        vol = data[..., i]
        means.append(np.mean(vol))
    return np.array(means)
def detect_outliers(some_values, n_stds=2):
    overall_mean = np.mean(some_values)
    overall_std = np.std(some_values)
    thresh = overall_std * n_stds
    is_outlier = (some_values - overall_mean) < -thresh
    return np.where(is_outlier)[0]
We apply this code to another image:
# Load the function to fetch the data file we need.
import nipraxis
# Fetch the data file.
another_data_fname = nipraxis.fetch_file('ds114_sub009_t2r1.nii')
# Show the file name of the fetched data
another_data_fname
'/home/runner/.cache/nipraxis/0.5/ds114_sub009_t2r1.nii'
more_means = vol_means(another_data_fname)
plt.plot(more_means)
[<matplotlib.lines.Line2D at 0x7f386c870400>]
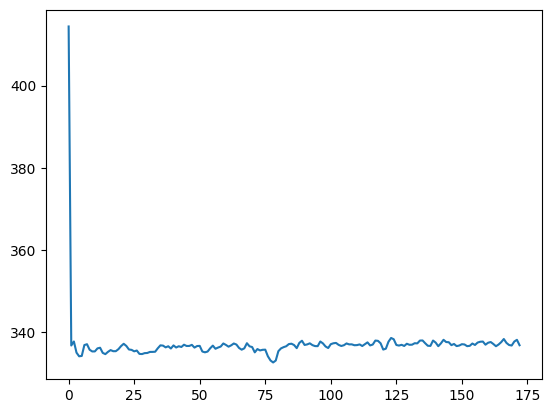
Apply the code:
detect_outliers(more_means)
array([], dtype=int64)
Oh no! It didn’t work? What’s the problem?
Back to on_modules
Back again#
Now we’ve worked out a better solution:
import volmeans
more_means_again = volmeans.vol_means(another_data_fname)
volmeans.detect_outliers_fixed(more_means_again)
array([0])