
General resampling between images with scipy.ndimage.map_coordinates#
Requirements:
Making coordinate arrays with
meshgrid;numpy.tranposefor swapping axes;The
nibabel.affinesmodule;Applying coordinate transforms with
nibabel.affines.apply_affine;
scipy.ndimage.affine_transform is a routine that samples between images where
there is an affine transform between the coordinates of the output image and
the input image.
scipy.ndimage.map_coordinates is a more general way of resampling between
images, where we specify the coordinates in the input image, for each voxel
coordinate in the output image.
Instead of using the implied coordinate grid, we pass in an actual coordinate array.
This means that we can resample using coordinate transformations that cannot be expressed as an affine, such as complex non-linear transformations.
map_coordinates accepts:
input– the array to resample from;coordinates– the array shape (3,) +output_shapegiving the voxel coordinates at which to sampleinput;
Here the output_shape is implied by the shape of coordinates.
map_coordinates then makes an empty array shape K where K = coordinates.shape[1:]. For every index i, j, k implied by K.shape
it:
gets the 3-length vector
coord = coordinates[:, i, j, k]giving the voxel coordinate ininput;samples
inputat coordinatescoordto give valuev;inserts
vintoKwithK[i, j, k] = v.
This might be clearer with an example. Let’s resample a structural brain image
to a functional brain image. See the Reslicing with affines exercise for
an exercise using scipy.ndimage.affine_transform to do this.
#: standard imports
import numpy as np
import numpy.linalg as npl
# print arrays to 4 decimal places
np.set_printoptions(precision=4, suppress=True)
import matplotlib.pyplot as plt
plt.rcParams['image.cmap'] = 'gray'
import nibabel as nib
We will need the:
BOLD (functional) image :
ds114_sub009_t2r1.nii;structural image :
ds114_sub009_highres.nii.
# Load the function to fetch the data file we need.
import nipraxis
# Fetch the BOLD image
bold_fname = nipraxis.fetch_file('ds114_sub009_t2r1.nii')
# Show the file name.
print(bold_fname)
# Fetch structural image
structural_fname = nipraxis.fetch_file('ds114_sub009_highres.nii')
# Show the file names
print(structural_fname)
/home/runner/.cache/nipraxis/0.5/ds114_sub009_t2r1.nii
/home/runner/.cache/nipraxis/0.5/ds114_sub009_highres.nii
bold_img = nib.load(bold_fname)
mean_bold_data = np.mean(bold_img.get_fdata(), axis=-1)
structural_img = nib.load(structural_fname)
structural_data = structural_img.get_fdata()
We now now the transformation to go from voxels in the structural to voxels in the (mean) functional:
mean_mm2vox = npl.inv(bold_img.affine)
struct_vox2mean_vox = mean_mm2vox @ structural_img.affine
struct_vox2mean_vox
array([[ -0.2497,   0.0151,  -0.0027,  63.5174],
       [  0.0115,   0.3242,   0.0137,   1.1053],
       [ -0.0034,  -0.0176,   0.2496, -27.7359],
       [  0.    ,   0.    ,   0.    ,   1.    ]])
Sure enough, if we use this affine to resample the functional image, we get a functional image with the same voxel sizes and positions as the structural image:
# Resample using affine_transform
from scipy.ndimage import affine_transform
mat, vec = nib.affines.to_matvec(struct_vox2mean_vox)
resampled_mean = affine_transform(mean_bold_data, mat, vec,
                                  output_shape=structural_data.shape)
# Show resampled data
fig, axes = plt.subplots(1, 2, figsize=(10, 5))
axes[0].imshow(resampled_mean[:, :, 150])
axes[1].imshow(structural_data[:, :, 150])
<matplotlib.image.AxesImage at 0x7f21a84ef2b0>
We get the exact same effect with map_coordinates if we create the voxel
coordinates ourselves, and apply the transform to them. We need
numpy.meshgrid to make the initial coordinate array:
# Get the I, J, K coordinates implied by the structural data array
# shape
I, J, K = structural_data.shape
i_vals, j_vals, k_vals = np.meshgrid(range(I), range(J), range(K),
                                     indexing='ij')
in_vox_coords = np.array([i_vals, j_vals, k_vals])
in_vox_coords.shape
(3, 256, 156, 256)
in_vox_coords[:, 0, 0, 0]
array([0, 0, 0])
in_vox_coords[:, 1, 0, 0]
array([1, 0, 0])
We transform the coordinate grid using nibabel’s apply_affine function:
coords_last = in_vox_coords.transpose(1, 2, 3, 0)
mean_vox_coords = nib.affines.apply_affine(struct_vox2mean_vox,
                                           coords_last)
coords_first_again = mean_vox_coords.transpose(3, 0, 1, 2)
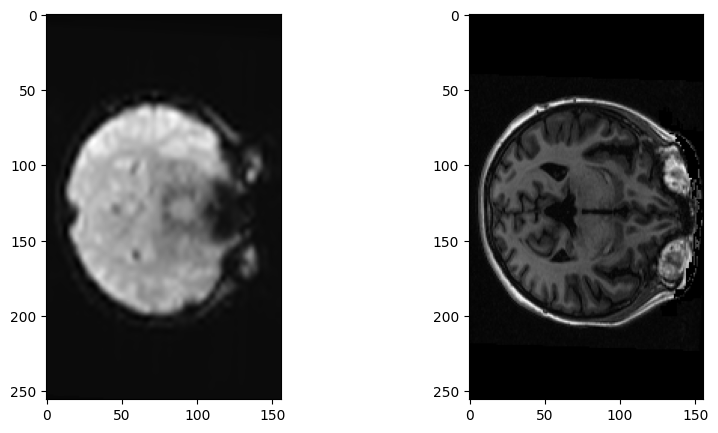
Use this with map_coordinates to get the same result as we got for
affine_transform:
# Resample using map_coordinates
from scipy.ndimage import map_coordinates
resampled_mean_again = map_coordinates(mean_bold_data,
                                       coords_first_again)
# Show resampled data
fig, axes = plt.subplots(1, 2, figsize=(10, 5))
axes[0].imshow(resampled_mean_again[:, :, 150])
axes[1].imshow(structural_data[:, :, 150])
<matplotlib.image.AxesImage at 0x7f219e59c070>