Subplots and axes in matplotlib#
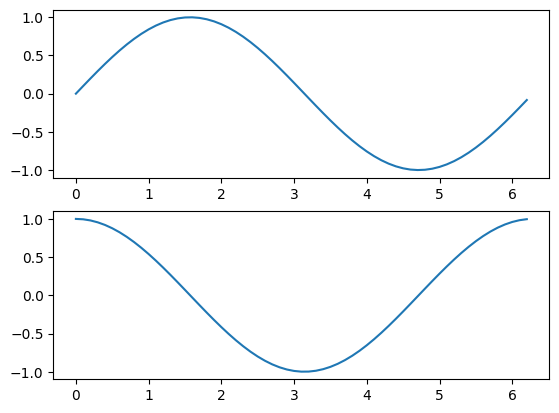
We often want to do several plots or images on the same figure.
We can do this with the matplotlib subplots command.
The standard input arguments to subplots are the number of rows and the
number of columns you want in your grid of axes. For example, if you want two
plots underneath each other you would call subplots(2, 1) for two rows and
one column.
subplots returns a figure object, that is an object representing the
figure containing the axes. It also returns a list of axes. The axes are
objects representing the axes on which we can plot. The axis objects have
methods like plot and imshow that allow us to plot on the given axes:
import numpy as np
import matplotlib.pyplot as plt
x = np.arange(0, np.pi * 2, 0.1)
fig, axes = plt.subplots(2, 1)
axes[0].plot(x, np.sin(x))
axes[1].plot(x, np.cos(x))
[<matplotlib.lines.Line2D at 0x7f78ec200040>]


